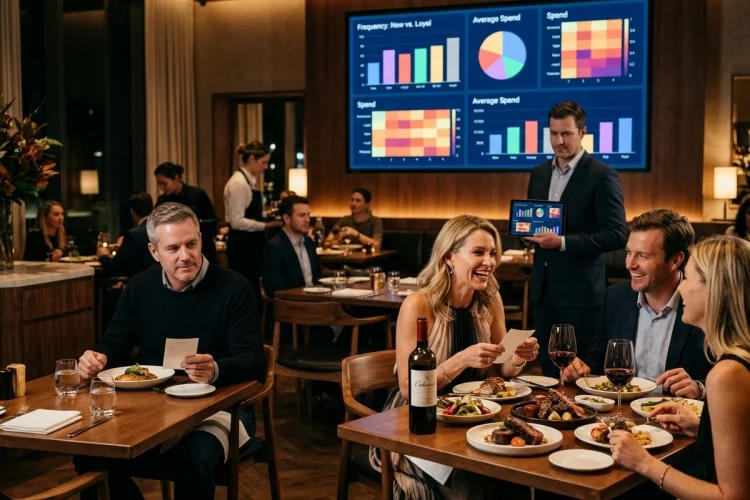
A hotel guest who eats breakfast every morning, a local who visits the rooftop bar twice a month, and a corporate client who organizes quarterly dinners may all generate similar annual spending.
Yet the reasons behind that value are completely different. Measuring Dining Frequency and Spend across hospitality guest segments helps operators see these distinctions.
When reservation, POS, loyalty, and cross-venue data are connected, hospitality groups can understand where revenue comes from, which relationships are strengthening, and how to increase guest value without relying on constant discounts or generic loyalty campaigns.
Look Beyond One Restaurant at a Time
Hospitality groups often operate several outlets serving the same customer.
A resort guest might eat breakfast at the all-day restaurant, order poolside lunch, visit the cocktail bar, and book a premium dinner venue during the same stay.
If every outlet measures that customer independently, their real value becomes fragmented.
SevenRooms describes centralized profiles that can combine guest visits, preferences, order history, and spending across locations and departments.
This enables a more complete metric:
Total Guest Spend = Sum of Spend Across All Connected Outlets
Imagine a customer spends only $90 at the flagship restaurant but another $500 annually across two sister concepts.
Evaluating the $90 transaction alone seriously understates the relationship.
For multi-venue hospitality businesses, customer value should be measured across the portfolio whenever data permissions and systems allow.
This also helps operators see which venues attract customers and which deepen the relationship later.
Distinguish Frequency From Engagement
Visit count is useful, but it does not capture every form of customer engagement.
One guest may visit six times but never respond to events, promotions, or seasonal menus. Another might visit only four times but attend ticketed dinners, purchase gift cards, and actively recommend the brand.
Frequency should therefore sit beside broader relationship indicators.
Restaurant guest profiles can combine reservations, POS history, preferences, special occasions, and marketing engagement to give teams a more complete understanding of customers.
Hospitality groups might score guests using several dimensions:
Visit Frequency + Spend + Occasion Value + Engagement + Recency
The model does not need to become an intimidating algorithm.
Even simple classifications can identify meaningful differences.
A “monthly regular” is different from an “event-driven premium guest,” even when annual spend is nearly identical.
Recognizing that distinction makes retention more precise.
Calculate Spend by Daypart and Outlet Type
Annual spending can hide where guest value actually originates.
Suppose a customer spends $1,200 annually with a hotel.
Perhaps $700 comes from the rooftop bar, $300 from dinner, and $200 from breakfast.
That person is primarily a beverage and social guest, not a traditional restaurant regular.
Another guest might generate the same $1,200 almost entirely through business lunches.
Daypart analysis reveals these patterns.
Operators can calculate:
Segment Spend Share = Segment Revenue in Daypart ÷ Total Segment Revenue
If local customers generate 65% of rooftop revenue but only 10% of breakfast revenue, marketing and operating priorities can reflect that difference.
This information also improves concept development.
A venue attracting high-frequency evening locals may deserve different programming from one relying mostly on transient hotel guests.
The goal is to understand not just how much a segment spends, but where and when that value is created.
Track the Time Between Visits
Two guests can each visit six times annually while exhibiting completely different patterns.
Guest A might visit once every two months.
Guest B could make all six visits during a two-week vacation and then disappear for the rest of the year.
Their annual frequency is identical, but their relationship with the business is not.
Time-between-visit analysis fixes this problem.
OpenTable identifies visit frequency, repeat-visit rate, guest retention, and time between visits as practical metrics for understanding whether customer relationships are becoming stronger.
Hotels and resorts should also consider stay patterns.
A returning resort guest may only have the opportunity to dine on property once per year. Measuring them against a local customer would produce a misleading frequency score.
The correct benchmark depends on realistic opportunity.
This is especially important for destination hospitality, where geography limits how frequently certain segments can return.
Good measurement uses context rather than arbitrary thresholds.
Separate High-Spend Occasions From Everyday Behavior
Premium spending often clusters around special occasions.
Birthday dinners, weddings, corporate entertainment, anniversaries, and holiday meals can generate checks far above a guest’s normal behavior.
Restaurants should capture that value without allowing it to distort the underlying segment.
For example, a guest spending $800 at one private dinner and $70 during four casual visits has two distinct behavioral patterns.
Reservation profiles that record party size, occasion, visit history, and spending can help operators separate these use cases.
Hospitality groups can then create an occasion value metric alongside everyday spend.
This matters commercially.
A customer who regularly organizes large groups might deserve private-dining outreach even if their individual dining frequency looks average.
Likewise, frequent low-spend bar visitors may still be highly attractive because their predictable demand helps fill quieter periods.
One annual number cannot explain all these relationships.
Use Loyalty Data as Another Behavioral Signal
Joining a loyalty program does not automatically make someone loyal.
Actual behavior matters more.
However, loyalty enrollment indicates that a guest has actively opened a communication channel with the business.
Toast’s July 2026 analysis found that loyalty enrollment in its dataset shifted guest return rates from a roughly 7% baseline to nearly 30%, while loyalty members at restaurants with active programs retained at approximately twice the rate of new customers.
Operators can therefore compare loyalty and non-loyalty segments using frequency, spend, and retention.
Do members actually visit more often?
Is their average spend different?
Do they respond to rewards or simply value recognition?
Toast also reported that 48% of surveyed guests said being remembered made them feel most valued at restaurants they frequent.
That suggests loyalty strategy should include human recognition rather than only points and discounts.
The strongest programs reinforce a relationship already visible in behavioural data.
Watch for Spend Compression Before Losing the Guest
Customer churn does not always begin with a complete disappearance.
Sometimes it starts with smaller checks.
A regular who previously ordered appetizers, premium wine, and dessert might continue visiting but begin ordering only an entrée.
That change can signal price pressure, declining perceived value, lifestyle shifts, or dissatisfaction.
Current consumer data makes spend compression particularly relevant.
The National Restaurant Association reported in its Q2 2026 survey that 36% of consumers were spending less at restaurants than in the previous quarter, with more diners cutting add-ons or choosing cheaper options.
Operators should therefore monitor both frequency and spend direction.
Four possible patterns emerge:
Frequent visits with rising spend signal a strengthening relationship.
Frequent visits with falling spend may indicate value pressure.
Declining frequency with stable spend suggests lower engagement.
Declining frequency and spend together deserve particular attention.
This kind of reconcilliation gives managers an early warning before a good customer becomes a completely lapsed one.
Turn the Analysis Into Segment-Level Strategies
Measurement becomes valuable when it changes what the business does.
High-frequency local guests might receive early access to neighborhood events. High-spend celebration customers could receive private-dining or anniversary communication.
Cross-venue guests can be introduced to sister concepts that match their established preferences.
OpenTable’s guest relationship management tools can automatically identify frequent guests and high spenders and surface relevant information before service.
The important rule is restraint.
Restaurants do not need twenty-seven tiny customer segments.
Start with groups that clearly imply different actions.
For example: new guests, developing regulars, established regulars, celebration guests, high-value cross-venue customers, and lapsed guests.
If management cannot explain what should change for a particular segment, that segment probably adds complexity without enough practical value.
The best analytics make decisions simpler.
Measuring Dining Frequency and Spend across hospitality segments reveals much more than who has the highest check.
Cross-venue behavior, daypart usage, visit gaps, occasions, loyalty, and spend direction show how different relationships create value.
Build a small set of actionable segments, track movement between them, and use those insights to strengthen retention and personalization before relying on broad promotions to generate another visit.